









Main Facts
Every solar panel and wind turbine begins its operational life deep in the dark. Before a single photon is converted into electricity or the first kilowatt-hour reaches the national power grid, an extraordinary amount of energy has already been consumed. Quartz must be mined from the earth, heavily refined into metallurgical silicon, processed into delicate wafers, assembled into photovoltaic cells, framed with carbon-intensive aluminum, wired with refined copper, and transported across oceans via heavy fuel oil.
This upfront investment is known as embodied energy. While it remains invisible once panels are gleaming in the desert sun or wind turbines are spinning gracefully on remote ridges, it has not disappeared from the equation. It is a profound ecological and physical debt that must be repaid over time.
Understanding this initial energy deficit is the foundational step in determining whether the global renewable energy transition is genuinely sustainable, or whether industrialized societies are simply trading one form of resource dependency for another.
The conversation surrounding renewable energy has historically focused almost exclusively on the operational phase—what happens after the master switch is flipped. Policymakers, investors, and climate advocates routinely ask:
- How much electricity does a specific wind farm generate?
- What is the levelized cost per kilowatt-hour (LCOE)?
- What are the operational carbon emissions?
While these metrics are vital, they ignore a more fundamental thermodynamic issue. They treat modern green energy systems as if they materialize out of thin air, assuming that the steel, concrete, copper, and silicon comprising them come with zero production cost.
To evaluate this reality, researchers rely on Energy Return on Investment (EROEI). At its core, EROEI is a straightforward ratio: for every single unit of energy invested in creating and maintaining a system, how many units of usable energy does that system return to society?
- A system with an EROEI of 10 returns ten units of energy for every one unit invested.
- A system with an EROEI of 1.5 barely breaks even, leaving almost no net energy surplus to fuel broader economic growth, healthcare, education, or infrastructure maintenance.
Historically, fossil fuels enjoyed staggeringly high EROEIs. Early petroleum extraction in the 19th and early 20th centuries yielded over 100 units of energy for every single unit invested. Even today, conventional oil and natural gas projects typically achieve EROEIs between 20:1 and 30:1.
The central, largely unaddressed question of the energy transition is whether renewable energy technologies can match these historical returns once the full life-cycle embodied energy—from raw mineral extraction to eventual decommissioning—is accurately accounted for.
Chronology
To fully grasp the magnitude of the embodied energy debt, it is helpful to trace the chronological lifecycle of renewable infrastructure, moving backward from the finished product to its geological origins.
Phase 1: Mineral Extraction and Refining
The lifecycle of a modern solar photovoltaic (PV) system or wind turbine begins with heavy earthmoving machinery powered by diesel fuel.
- Silicon Extraction: Quartz rock is mined, crushed, and treated in electric arc furnaces operating at temperatures exceeding 1,900°C (3,450°F) to produce metallurgical-grade silicon, which is subsequently purified into solar-grade polysilicon.
- Metal Smelting: Wind turbines require vast quantities of steel, necessitating the large-scale mining of iron ore and metallurgical coal. Copper wiring demands extensive mining, smelting, and chemical refining.
- Composite Manufacturing: Turbine blades are made from advanced fiberglass and carbon-fiber composites, requiring petroleum-based chemical inputs and energy-intensive curing processes.
Phase 2: Component Manufacturing and Logistics
Once raw materials are refined, they are shipped to specialized manufacturing hubs—often located thousands of miles away from where they will ultimately be installed.
- Semiconductor fabrication plants consume massive amounts of ultra-clean electricity and ultrapure water to transform polysilicon into ingots, wafers, and solar cells.
- Aluminum extruders shape framing materials, while heavy-duty industrial transport—including cargo ships, freight trains, and heavy trucks—burns millions of barrels of heavy bunker fuel and diesel to move finished components across continents.
Phase 3: Infrastructure Construction and Grid Integration
The installation phase introduces another massive wave of energy consumption. Constructing a utility-scale wind or solar farm requires clearing land, pouring thousands of tons of concrete foundations, laying underground high-voltage cabling, and erecting heavy-duty substations. Grid integration often requires building thousands of miles of new transmission lines, further compounding the upstream energy investment.
Phase 4: Operation, Degradation, and Repaid Debt
Once commissioned, the facility enters its operational phase. During this period, generation begins, and the installation slowly works to pay back its "energy debt." However, this repayment rate is governed by variable environmental conditions, component degradation (such as solar panel micro-cracking and yellowing encapsulants), inverter replacements every 10 to 15 years, and routine maintenance downtime.
Phase 5: Decommissioning and Recycling
At the end of a project’s lifecycle—typically estimated between 20 to 30 years—the facility must be decommissioned. Dismantling massive concrete foundations, recycling complex multi-layer solar panels, and handling hazardous industrial waste require yet another expenditure of energy, completing the full thermodynamic loop.
Supporting Data
Calculating EROEI is conceptually straightforward, but the results vary wildly depending on analytical boundaries and geographic assumptions.
The Boundary Problem
The primary debate among energy modelers centers on where the accounting boundary is drawn:
- Narrow Boundary: Some assessments calculate only the direct energy required to assemble solar panels or wind turbines inside the factory. These studies frequently report high EROEI figures for solar PV, sometimes exceeding 10:1 or even 15:1.
- Comprehensive Boundary: Comprehensive life-cycle analyses (LCAs) include upstream raw material extraction (diesel for mining equipment), chemical processing, international freight transport, foundational concrete manufacturing, grid connection infrastructure, maintenance, and end-of-life decommissioning. When these factors are included, the EROEI for solar and wind drops significantly, often landing closer to 3:1 or 6:1, depending on geography.
Asset Lifetime and Capacity Factors
Asset longevity is another critical variable that skews data projections. A solar panel guaranteed to operate for 40 years yields twice the lifetime energy return of a panel that degrades or fails after 20 years. Yet, aggressive degradation rates, extreme weather events, and inverter failure cycles are frequently underestimated in optimistic promotional forecasts.
Geographic location dictates the natural capacity factor—the ratio of actual electrical output over a given period compared to theoretical maximum output:
- A solar farm installed in the high-irradiance deserts of Arizona or the United Arab Emirates generates vastly more electricity per megawatt than an identical installation in overcast Northern Europe.
- Furthermore, phenomena like grid curtailment—where green energy generation is deliberately throttled down or disconnected because transmission lines are overburdened or supply exceeds regional demand—further degrade the real-world energy return.
Official Responses
As the debate surrounding net-energy metrics and embodied carbon intensifies, international energy agencies and industry stakeholders have begun responding to criticisms regarding the true cost of the green transition.
The International Energy Agency (IEA) Perspective
The IEA maintains that while upstream mineral intensity and embodied energy are substantial challenges, technological improvements in manufacturing efficiency are rapidly driving down the energy payback time (EPBT) of solar and wind installations. According to recent IEA data, the energy payback time for modern utility-scale solar PV in favorable climates has dropped to between one and two years, meaning the panel quickly repays its manufacturing debt and spends the vast majority of its operational life producing net-positive energy.
Industry and Critic Counter-Analyses
Independent energy analysts and engineering critics argue that IEA models often rely on best-case factory scenarios while underestimating indirect systemic costs. Critics point out that as high-grade mineral ores are depleted worldwide, mining companies are forced to process increasingly lower-grade ores, which requires exponentially more diesel, electricity, and water per ton of refined metal.
Furthermore, industrial trade associations emphasize that recycling technologies for solar panels and wind turbine blades are still in their infancy. Without closed-loop recycling infrastructure, future replacements will require virgin raw materials, locking industrial economies into a perpetual cycle of high embodied energy consumption.
Implications
The rigorous examination of embodied energy and EROEI carries profound implications for global economic planning, climate policy, and geopolitical stability.
1. Revisiting the Speed of the Transition
The realization that renewable energy systems carry a heavy upfront energy debt complicates the narrative of a rapid, painless global transition. If society attempts to scale wind and solar manufacturing too aggressively using energy sourced primarily from declining fossil fuel systems, the immediate net energy available for general societal consumption (such as food production, transportation, and public services) could temporarily contract. This phenomenon, known in energy economics as the "energy transition trap," suggests that building the future energy system requires sacrificing substantial energy today.
2. A Case Study in Reassessment: Al Dhafra Solar PV Project
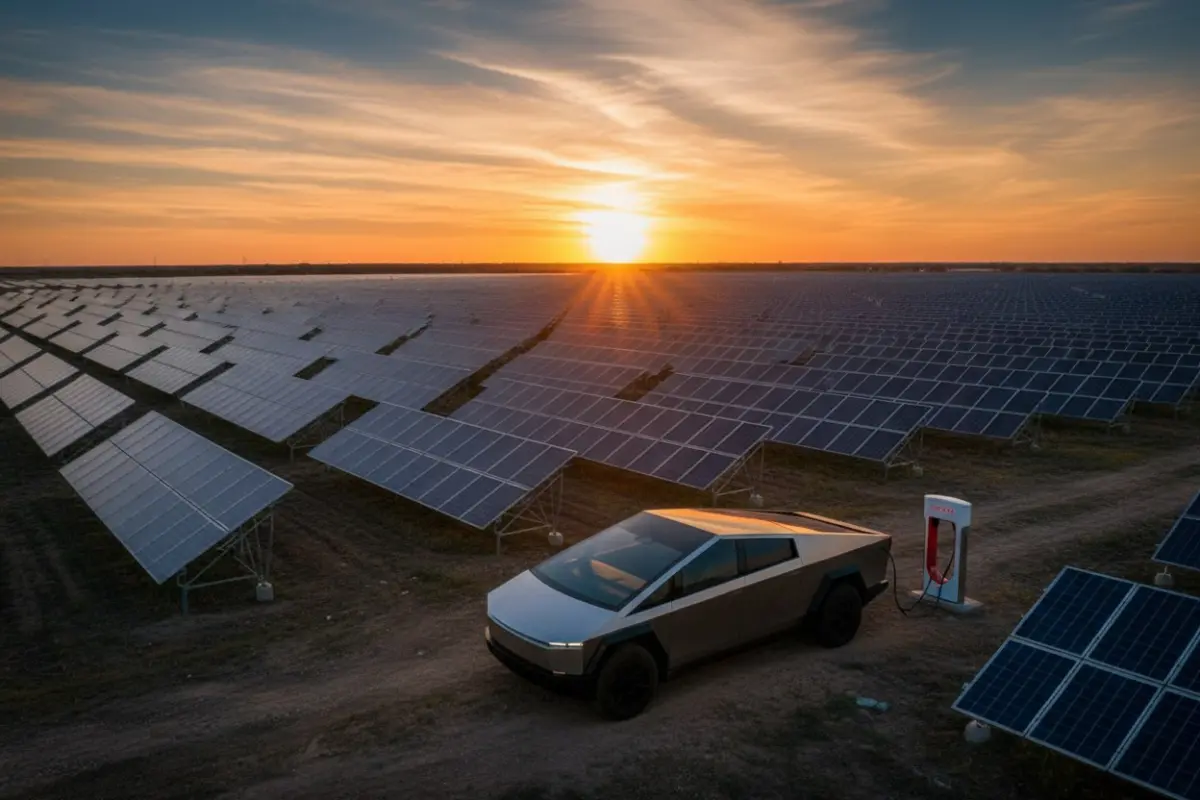
The Al Dhafra Solar PV project in the United Arab Emirates serves as a prominent case study. Advertised as one of the world’s largest single-site solar installations with an installed capacity of 2 gigawatts, the project demonstrates the undeniable physical feasibility of utility-scale solar in high-irradiance regions.
However, looking backward through its physical supply chain reveals the underlying complexity:
- Millions of tons of quartz-derived silicon, steel mounting structures, and refined copper wiring were imported, each carrying a heavy embodied energy toll.
- Regional environmental factors—such as dust accumulation requiring frequent water cleaning, inverter inefficiencies, and performance degradation—reduce theoretical maximum output.
- Factoring in local solar radiation and system losses, the facility operates at a real-world annual capacity factor closer to 25%.
When total lifetime generation is weighed against the massive energy investments required for construction, upkeep, and eventual decommissioning, Al Dhafra remains a net producer of energy—but its true surplus must be calculated realistically rather than theoretically.
3. Toward a Nuanced Future
None of this analysis implies that renewable energy is unviable or should be abandoned. Solar and wind power remain indispensable pillars of a diversified, low-carbon global energy mix, particularly in regions endowed with exceptional natural resources.
Instead, these findings urge policymakers, economists, and engineers to adopt a more honest, holistic accounting framework. The global energy transition is not simply a matter of swapping out old power plants for new ones on a one-to-one basis. It is a complex thermodynamic restructuring of human civilization. Recognizing the hidden energy debt of our infrastructure is the first step toward ensuring that our renewable future is genuinely sustainable, resilient, and built to last.